

Introduction
The U.S. economy entered the second half of 2026 on firmer footing than many economists had expected. Through the year’s first and second quarters, consumer spending remained resilient, business investment continued to support growth, and the national outlook for gross domestic product growth improved. Meanwhile, the forces driving economic expansion have begun to shift. Slowing labor force growth, persistent trade policy uncertainty and global supply chain disruptions have led firms across a wide range of industries to focus on enhancing productivity, rather than simply hiring, to sustain expansion.
These developments pose an important question for regional economies: How are metropolitan areas adapting to an economic reality where productivity, rather than labor force expansion, increasingly drives growth? Addressing this question from two perspectives, this report presents the analysis of updates to the Kenan Institute of Private Enterprise’s American Growth Project dataset, incorporating newly available data, methodological improvements and revised forecasts for the nation’s metro areas. The updated analysis points to an economic outlook that is moderately stronger than earlier in the year, featuring upgraded GDP forecasts despite slower expected employment growth.
In this report, we examine wholesale trade, a subsector of the Trade and Transportation sector, to develop a better understanding of how productivity shapes regional competitiveness. The choice of industry is deliberate. Wholesale firms occupy a critical position in supply chains, facilitating the movement of goods between producers and customers. These businesses must operate efficiently for manufacturers to maintain production levels, retailers to keep products on shelves, and organizations to adjust to changing market conditions.
Our analysis reveals that distinct metropolitan economies’ wholesale trade industries compete in fundamentally different ways. Some regions have built large wholesale sectors that serve as commercial hubs for surrounding states and industries. Others generate strong economic output from relatively small workforces, demonstrating that competitive advantage is not solely a function of metropolitan size. These findings show that there is more than one pathway to build a competitive wholesale trade sector. As digital technologies reshape supply chain management and labor markets remain constrained, understanding the different ways that regions build a productive wholesale sector may shed light on which regional economies are best positioned for long-term growth.
Economic Update: What’s Changed Since Early 2026?
The Empowering American Cities initiative’s analytical foundation is a dataset covering 150 Extended Metropolitan Areas — economically integrated regions that together account for approximately 90% of U.S. economic activity. Drawing on government and academic data sources, the initiative produces forecasts of GDP growth, employment growth and housing permit activity. The initiative also measures each region’s distinctive industry and demographic mix, referred to here as Embedded Local Growth Characteristics. Since the start of 2026, new economic data has become available, and we have enhanced our methodology to update our economic forecasts and provide a clearer picture of how regional economies have grown and shifted throughout the year.
The outlook has improved
The updated data points to a somewhat stronger economic outlook than we had expected at the beginning of the year, although the improvements are not uniform across all indicators. Housing permits showed the largest upward revision. Across all 150 EMAs, expected permit growth increased by 7.8 percentage points relative to the February forecast. The improvement was particularly pronounced among the 100 midsize EMAs, where average permit growth increased by 9.6 percentage points, compared with 4.4 percentage points among the top 50 metropolitan areas.
GDP forecasts also improved substantially (see Figure 1). Average projected GDP growth across the 150 EMAs increased from 1.1% to 2.1%, reflecting a stronger national economy than we had expected earlier in the year. The midsize 100 experienced the larger upward revision, with average GDP forecasts increasing by 1.1 percentage points, compared with 0.6 percentage points among the top 50. A handful of metropolitan areas, including Rochester, Minnesota, and Fort Collins, Colorado, experienced modest downward revisions. Yet both of these EMAs still post moderately strong projected growth of approximately 2.1% and 2.0%, respectively.
Figure 1: GDP Growth Map for 150 EMAs
Employment tells a somewhat different story. Expected employment growth softened compared with forecasts from the beginning of the year. Average employment growth for the top 50 EMAs declined from 0.7% to 0.5%, while the average for the midsize 100 declined from 0.6% to 0.5%. Several metropolitan areas, including Savannah, Georgia, and Fayetteville, North Carolina, bucked the trend and saw their employment outlook improve modestly, by 0.26 and 0.13 percentage points, respectively. See Table 1 for the most up-to-date employment, housing and GDP forecasts across the 50 largest EMAs.
Why the outlook changed
The improved GDP outlook at the EMA level largely reflects stronger-than-expected national economic performance. At the beginning of the year, our forecasting models assumed 1.45% U.S. GDP growth for 2026. The updated forecast now assumes 2.2% growth, which gives a stronger foundation for metropolitan economies across the country.
The enhanced outlook also incorporates important methodological improvements. Earlier forecasts relied on two separate annual models — one for the top 50 EMAs and another for the midsize 100. The revised forecasts introduce Mixed Data Sampling, or MIDAS, models, allowing us to combine annual economic indicators with weekly, monthly and quarterly data. By incorporating these high-frequency signals, the models capture economic trends that would otherwise be lost through annual aggregation. We combine the traditional and MIDAS models using performance-based weighting to produce a single forecast for each metropolitan area.
Why it matters: increasing production with a steady labor force
The updated forecasts point to an economy in which GDP is expected to grow faster than employment. The slowing of labor force growth means that many regions will be challenged to expand their workforce. These countervailing trends raise a key question: How will metropolitan economies increase output with a persistently limited labor supply?
Seeking answers to this question, we look at wholesale trade, a keystone subsector that touches nearly every other economic sector, meaning that its performance is a useful indicator of regional competitiveness. Examining wholesale trade across metropolitan areas shows where supply chains are concentrated and where they generate the greatest economic value. In the next section, we delve into why wholesale trade plays a central role in regional economies and introduce the economic measures we use to link the sector with regional performance.
Wholesale Trade’s Importance for the U.S. Supply Chain
Wholesale trade is the coordination and distribution layer of the economic goods’ supply chain, moving goods from where they are produced to where they are ultimately used. Grainger, Fastenal and Sysco are prominent examples of wholesale trade firms. Rather than manufacturing products, these companies help other businesses procure critical supplies, manage inventories and keep operations running smoothly. This coordinating role has become increasingly important as supply chains have grown more complex and trade-related uncertainty has persisted.
Other economic sectors depend on wholesale trade, yet this essential supply chain layer is often overlooked. Manufacturers rely on wholesalers to provide timely access to parts, equipment and raw materials, while retailers depend on them to keep products on their shelves. When wholesale networks function efficiently, businesses can operate with confidence. When these connections strain, inventories become difficult to manage and costs go up, which often results in higher prices passed through to consumers.
Wholesale firms occupy distinct roles in different metropolitan economies, and the sector’s economic importance varies accordingly. In some regions, wholesale trade is a major employer and an important contributor to regional output. In others, the sector employs relatively few workers yet generates disproportionately high levels of economic output. Understanding these differences requires looking beyond any single metric. The analysis that follows examines three complementary indicators — employment, GDP and productivity — to identify not only where wholesale trade has the most breadth but also where it creates the greatest economic value.
Analysis: Wholesale Trade as a Window into Regional Competitiveness
Where it makes up a substantial share of GDP and employment
Wholesale trade’s economic importance varies substantially across metropolitan economies (see Table 2). In some regions, wholesalers primarily support local businesses and consumers. In others, the subsector has become a defining feature of the regional economy, accounting for a substantial share of both employment and GDP. These regions are commercial hubs, connecting producers and customers across markets that extend well beyond the metropolitan area itself.
Among the 50 largest EMAs, large wholesale sectors tend to be the hallmark of places with broad commercial reach. These metros combine large business markets with transportation networks that allow firms to serve customers across multiple states or, in some cases, international markets.
Houston is a clear example of such a metro. Wholesale trade accounts for 5.2% of regional employment but 11.8% of GDP, the largest GDP share among the 150 EMAs. Wholesalers operating in this EMA support far more than local demand, serving the region’s energy, petrochemical, industrial and trade-related economy. Memphis and Chicago reflect a similar model, relying on strong transportation connections and their role as major distribution centers. In these metros, wholesale trade creates value largely through scale, coordinating a high volume of commercial activity across broad geographic markets.
Large wholesale sectors in midsize EMAs have a similar but more regional economic role. Rather than serving national markets across many industries, these wholesalers often act as commercial centers for surrounding manufacturing or agricultural economies. Illustrating this model, wholesale trade in Fort Wayne, Indiana, accounts for just over 8% of regional GDP and about 4.6% of employment. The sector supports northeastern Indiana’s manufacturing base by helping producers obtain industrial inputs and reach customers throughout the Midwest. Wholesalers in other Fifth Third Bank markets, including Dayton, Ohio, and Lexington, Kentucky, also have meaningful employment and GDP shares. These companies’ advantage comes less from operating as national gateways and more from connecting nearby producers, suppliers and customers within established regional business networks.
Where wholesale generates the most productivity
The share of a region’s economy devoted to wholesale trade is a useful metric, but it does not fully capture the subsector’s contribution to regional competitiveness. An equally important measure gauges how much GDP wholesalers generate in proportion to the size of their workforce. In nearly every EMA, the subsector accounts for a larger share of GDP than employment, indicating above-average output per worker. The highest-productivity wholesale economies are distinguished not simply by how much product moves through them, but by the broader industry and business ecosystems.
Figure 2: How Wholesale Trade Creates Value Across America’s Microeconomies
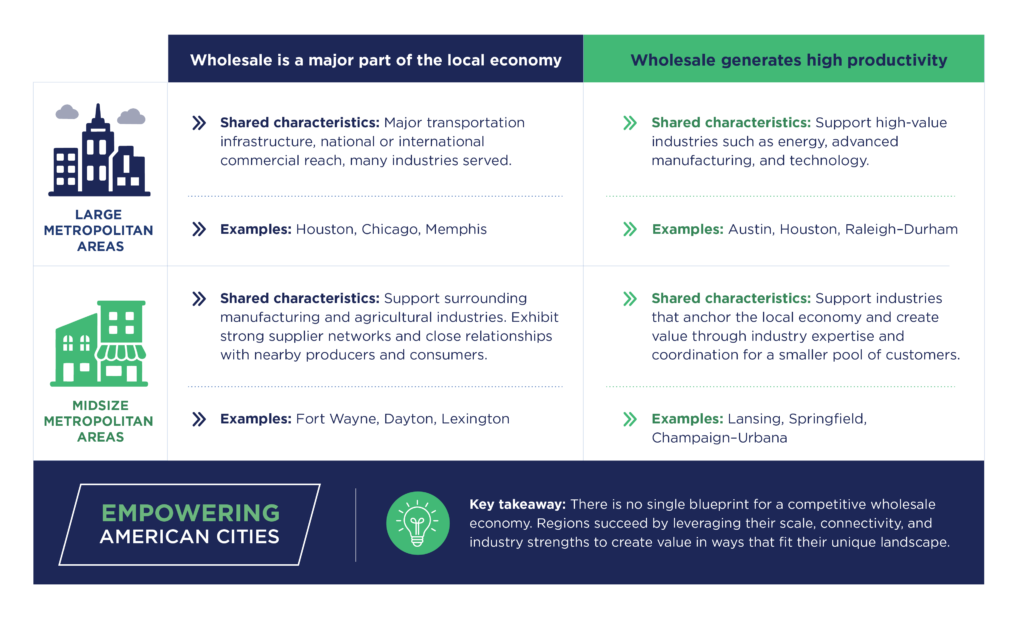
Among the 50 largest EMAs, high wholesale productivity is often associated with complex industrial or innovation ecosystems. Austin, for example, generates more than 10% of its GDP from wholesale trade with 4% of its workforce, yielding a productivity ratio of 2.51. Austin’s wholesale sector operates in a regional economy boosted by high-value industries including semiconductors, electronics and advanced manufacturing. Houston combines a large wholesale presence with similarly high productivity, reflecting its role in energy, petrochemicals and industrial supply chains. Pittsburgh and Raleigh-Durham follow the same pattern, serving high-value business markets tied to advanced manufacturing, technology and life sciences. In these regions, value is created by supplying specialized products, coordinating procurement and supporting industries whose operations depend on complex business-to-business relationships.
Highly productive wholesale industries based in midsize EMAs follow a somewhat different model. Their advantage generally comes from deep specialization rather than the breadth of a large metropolitan economy. The wholesale sector in Lansing, Michigan, has the highest productivity ratio in the dataset at 3.06 — the sector accounts for about 7.4% of GDP but only 2.4% of employment. Its wholesale firms are closely connected to Michigan’s manufacturing economy, allowing a relatively small workforce to support high-value commercial activity. Springfield and Champaign-Urbana, both in Illinois, show a similar pattern, with productivity ratios of 2.97 and 2.29, respectively. In these regions, wholesalers become effective intermediaries for the industries that anchor the local economy, creating value by understanding those industries’ purchasing needs, maintaining inventories and connecting local firms with specialized suppliers and customers.
Our findings reveal four distinct models of wholesale competitiveness. Large metropolitan hubs build sizable wholesale sectors through market reach and transportation connectivity. Midsize commercial centers perform a similar role for surrounding regional industries. High-productivity large metros create value by supporting high-value industries, such as energy, advanced manufacturing, technology and life sciences, that depend on specialized business-to-business supply chains. High-productivity midsize metros develop deep expertise in the industries that dominate their regional economies. Metropolitan size therefore influences the scale of wholesale trade, but the character of the surrounding economy shapes how much value the sector generates from each worker.

Case Study
Houston
Houston stands out for its large and highly productive wholesale sector. Wholesale trade accounts for 11.8% of regional GDP — the largest share among the 150 EMAs — compared with 5.2% of employment. With a productivity factor of 2.27, the sector generates more than twice the share of regional output than its employment footprint alone would suggest. Houston also performs well relative to other major metros, ranking eighth in wholesale trade productivity among the 50 largest EMAs.
Houston’s connections to global markets and its role as a major industrial center help explain this strength. The Houston Ship Channel complex is the nation’s largest port by waterborne tonnage, encompassing both public and private terminals. High-value exports such as mineral fuels, chemicals and plastics move through the region alongside imports of machinery, electrical equipment, steel and fuels. These trade flows are closely intertwined with Houston’s concentration of energy, petrochemical and industrial firms, creating substantial demand for wholesalers that buy, sell and distribute commodities domestically and internationally.
Houston’s wholesale advantage, then, is about more than the presence of a major port. It reflects the intersection of industrial specialization, infrastructure and market reach. Wholesalers benefit from proximity to a dense network of producers, refineries, chemical plants and corporate buyers, while Houston’s port, rail and highway connections provide access to customers well beyond the region. The result is a sector capable of generating substantial economic output without requiring a proportionately large workforce. That helps distinguish Houston from several of its large Southern peers, including Orlando, New Orleans and Atlanta, and provides one example of the high-value industries supporting Houston’s strong economic performance in 2026.
Looking Ahead: Implications for Fifth Third Markets
This report’s findings indicate that the next phase of regional competitiveness may depend on helping existing businesses leverage their existing workforce to become more productive. For wholesale firms, this means using technology to improve how supply chains are managed rather than simply increasing capacity. AI-enabled demand forecasting, inventory optimization, and automated purchasing systems are already helping firms anticipate customer needs, reduce inventory costs, and make better purchasing decisions with the workforce they have in place.
For many communities in Fifth Third’s footprint, these developments present an opportunity rather than a challenge. Markets such as Indianapolis, Louisville, Grand Rapids, Fort Wayne, and Lexington possess many of the characteristics associated with productive wholesale economies, including strong manufacturing bases and well-established supplier networks. Technology can help build on these prevailing strengths. AI-assisted inventory management, for example, can improve coordination between manufacturers and suppliers in Fort Wayne’s industrial economy, while logistics optimization tools can help firms in Indianapolis move goods more efficiently through one of the Midwest’s largest distribution networks. As labor force growth slows, productivity gains such as these will be an increasingly important driver of regional competitive advantage.
This analysis suggests there is no single blueprint for building a competitive wholesale economy. Some metropolitan areas create advantage by serving as commercial hubs for broad regional markets while others excel by supporting advanced manufacturing or other industries that anchor their local economies. Technology is unlikely to change these models. Instead, technological development will likely strengthen existing processes, allowing regions to build on the competitive advantages they already possess. For Fifth Third, understanding how each market creates value — not simply how large its wholesale sector is — provides a robust foundation for identifying long-term opportunities for business investment and economic growth.
KEY TAKEAWAYS
- Regional economic growth projections strengthened in the first half of 2026. Updated forecasts point to stronger GDP growth and housing activity across U.S. metropolitan areas, despite somewhat softer employment expectations. Average projected GDP growth across these 150 metros increased from 1.1% to 2.1%, reflecting a more resilient economy than anticipated earlier in the year.
- Productivity is becoming increasingly important to economic growth and regional competitiveness. Stronger GDP forecasts alongside slower employment growth underscore the importance of generating more output with a limited workforce. Wholesale trade illustrates this dynamic: Across nearly every metropolitan area, the sector contributes a larger share of GDP than employment, highlighting its role in creating economic value.
- Many Fifth Third Bank markets benefit from both regional commercial influence and industry specialization. Some metropolitan areas serve as major commercial hubs connecting businesses across broad markets, while others generate substantial value by supporting specialized industries such as manufacturing, energy and technology. Markets that combine these strengths are particularly well positioned to capitalize on productivity-enhancing technologies and sustain their competitive advantages.

